This week was dedicated to create a map of the Knowledge Mile. We have chosen to work on the cuisine and restaurants of the different countries. First, we started by collecting data on the way. Sounds, business cards, photos, descriptions. These data were then selected to be collected on a map. We decided to work on the smells of the city and restaurants. To do this, we looked for the spices and herbs that countries use in their traditional dishes. Indeed, on the way, we could smell different smells of food depending on the surrounding restaurants. We used the most common spices and herbs to make them smell on our map.
MY PARTNER?
Rick V
WHAT DID I LEARN?
TECNICS:
- Collecting datas
- Mapping
MATERIALS:
- MDF
- Paper
- Glass boxes
- Herbs/spices
MACHINES/SOFTWARES:
- Illustrator
- Laser cut
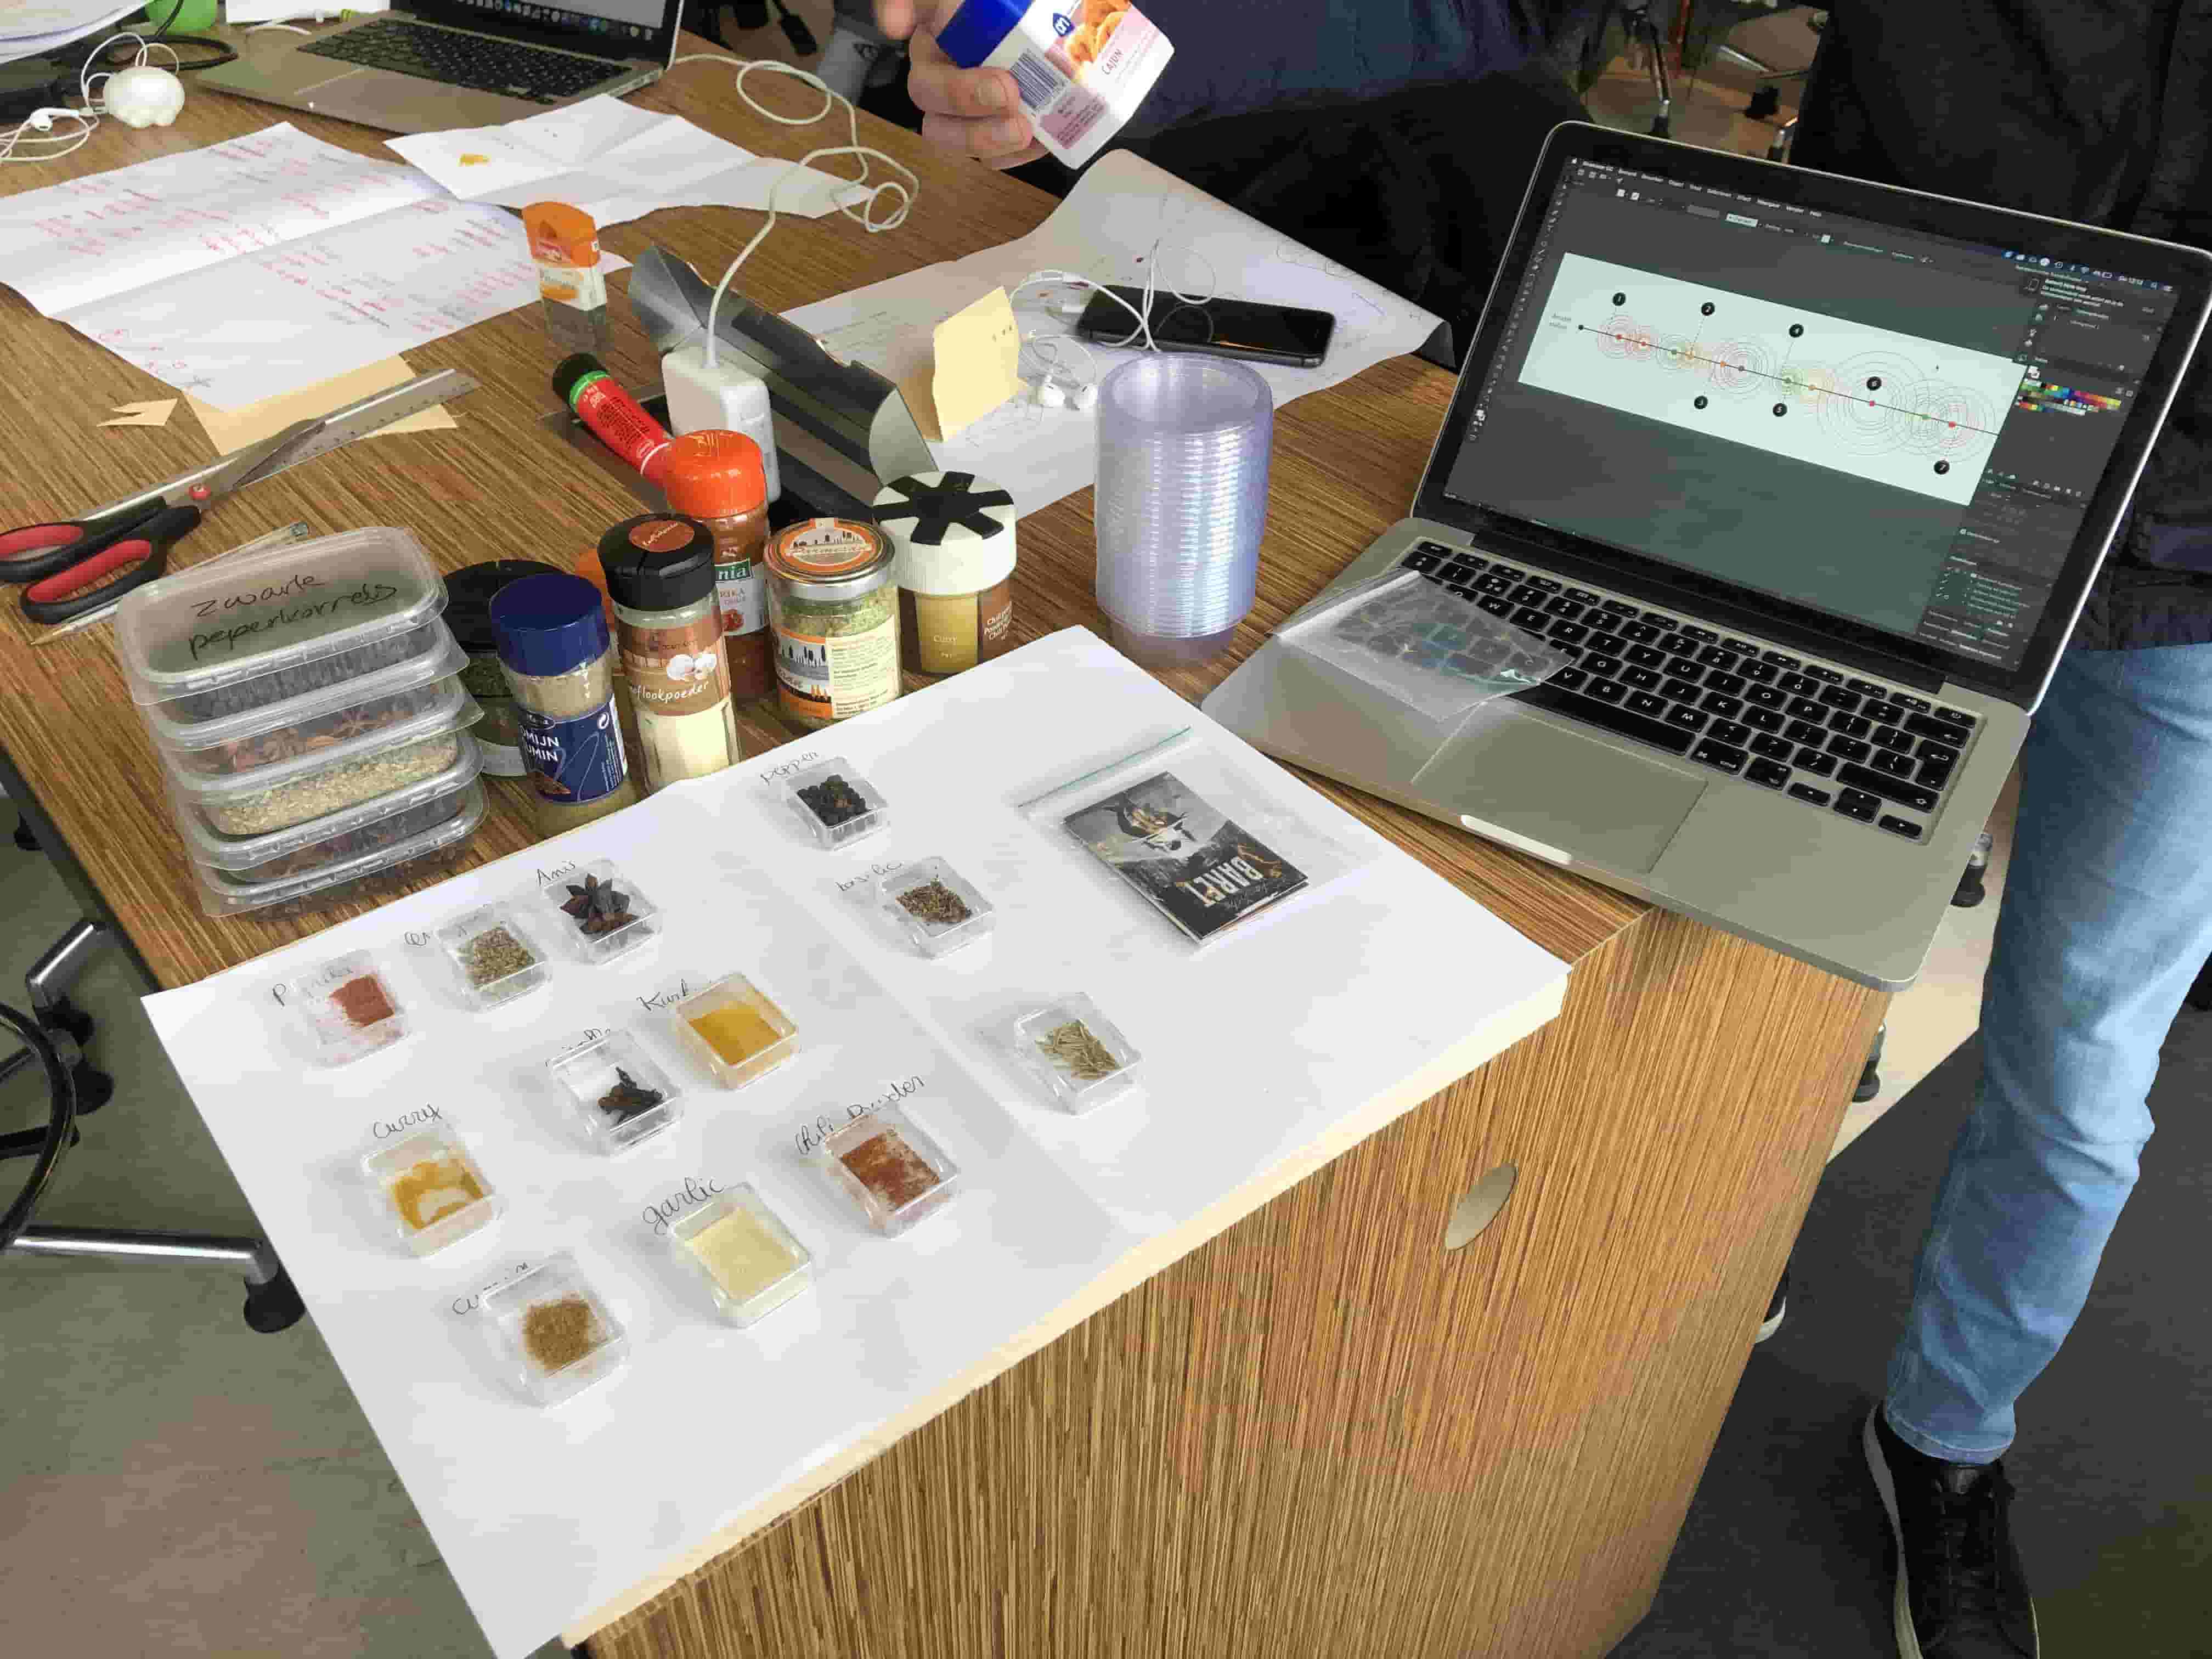
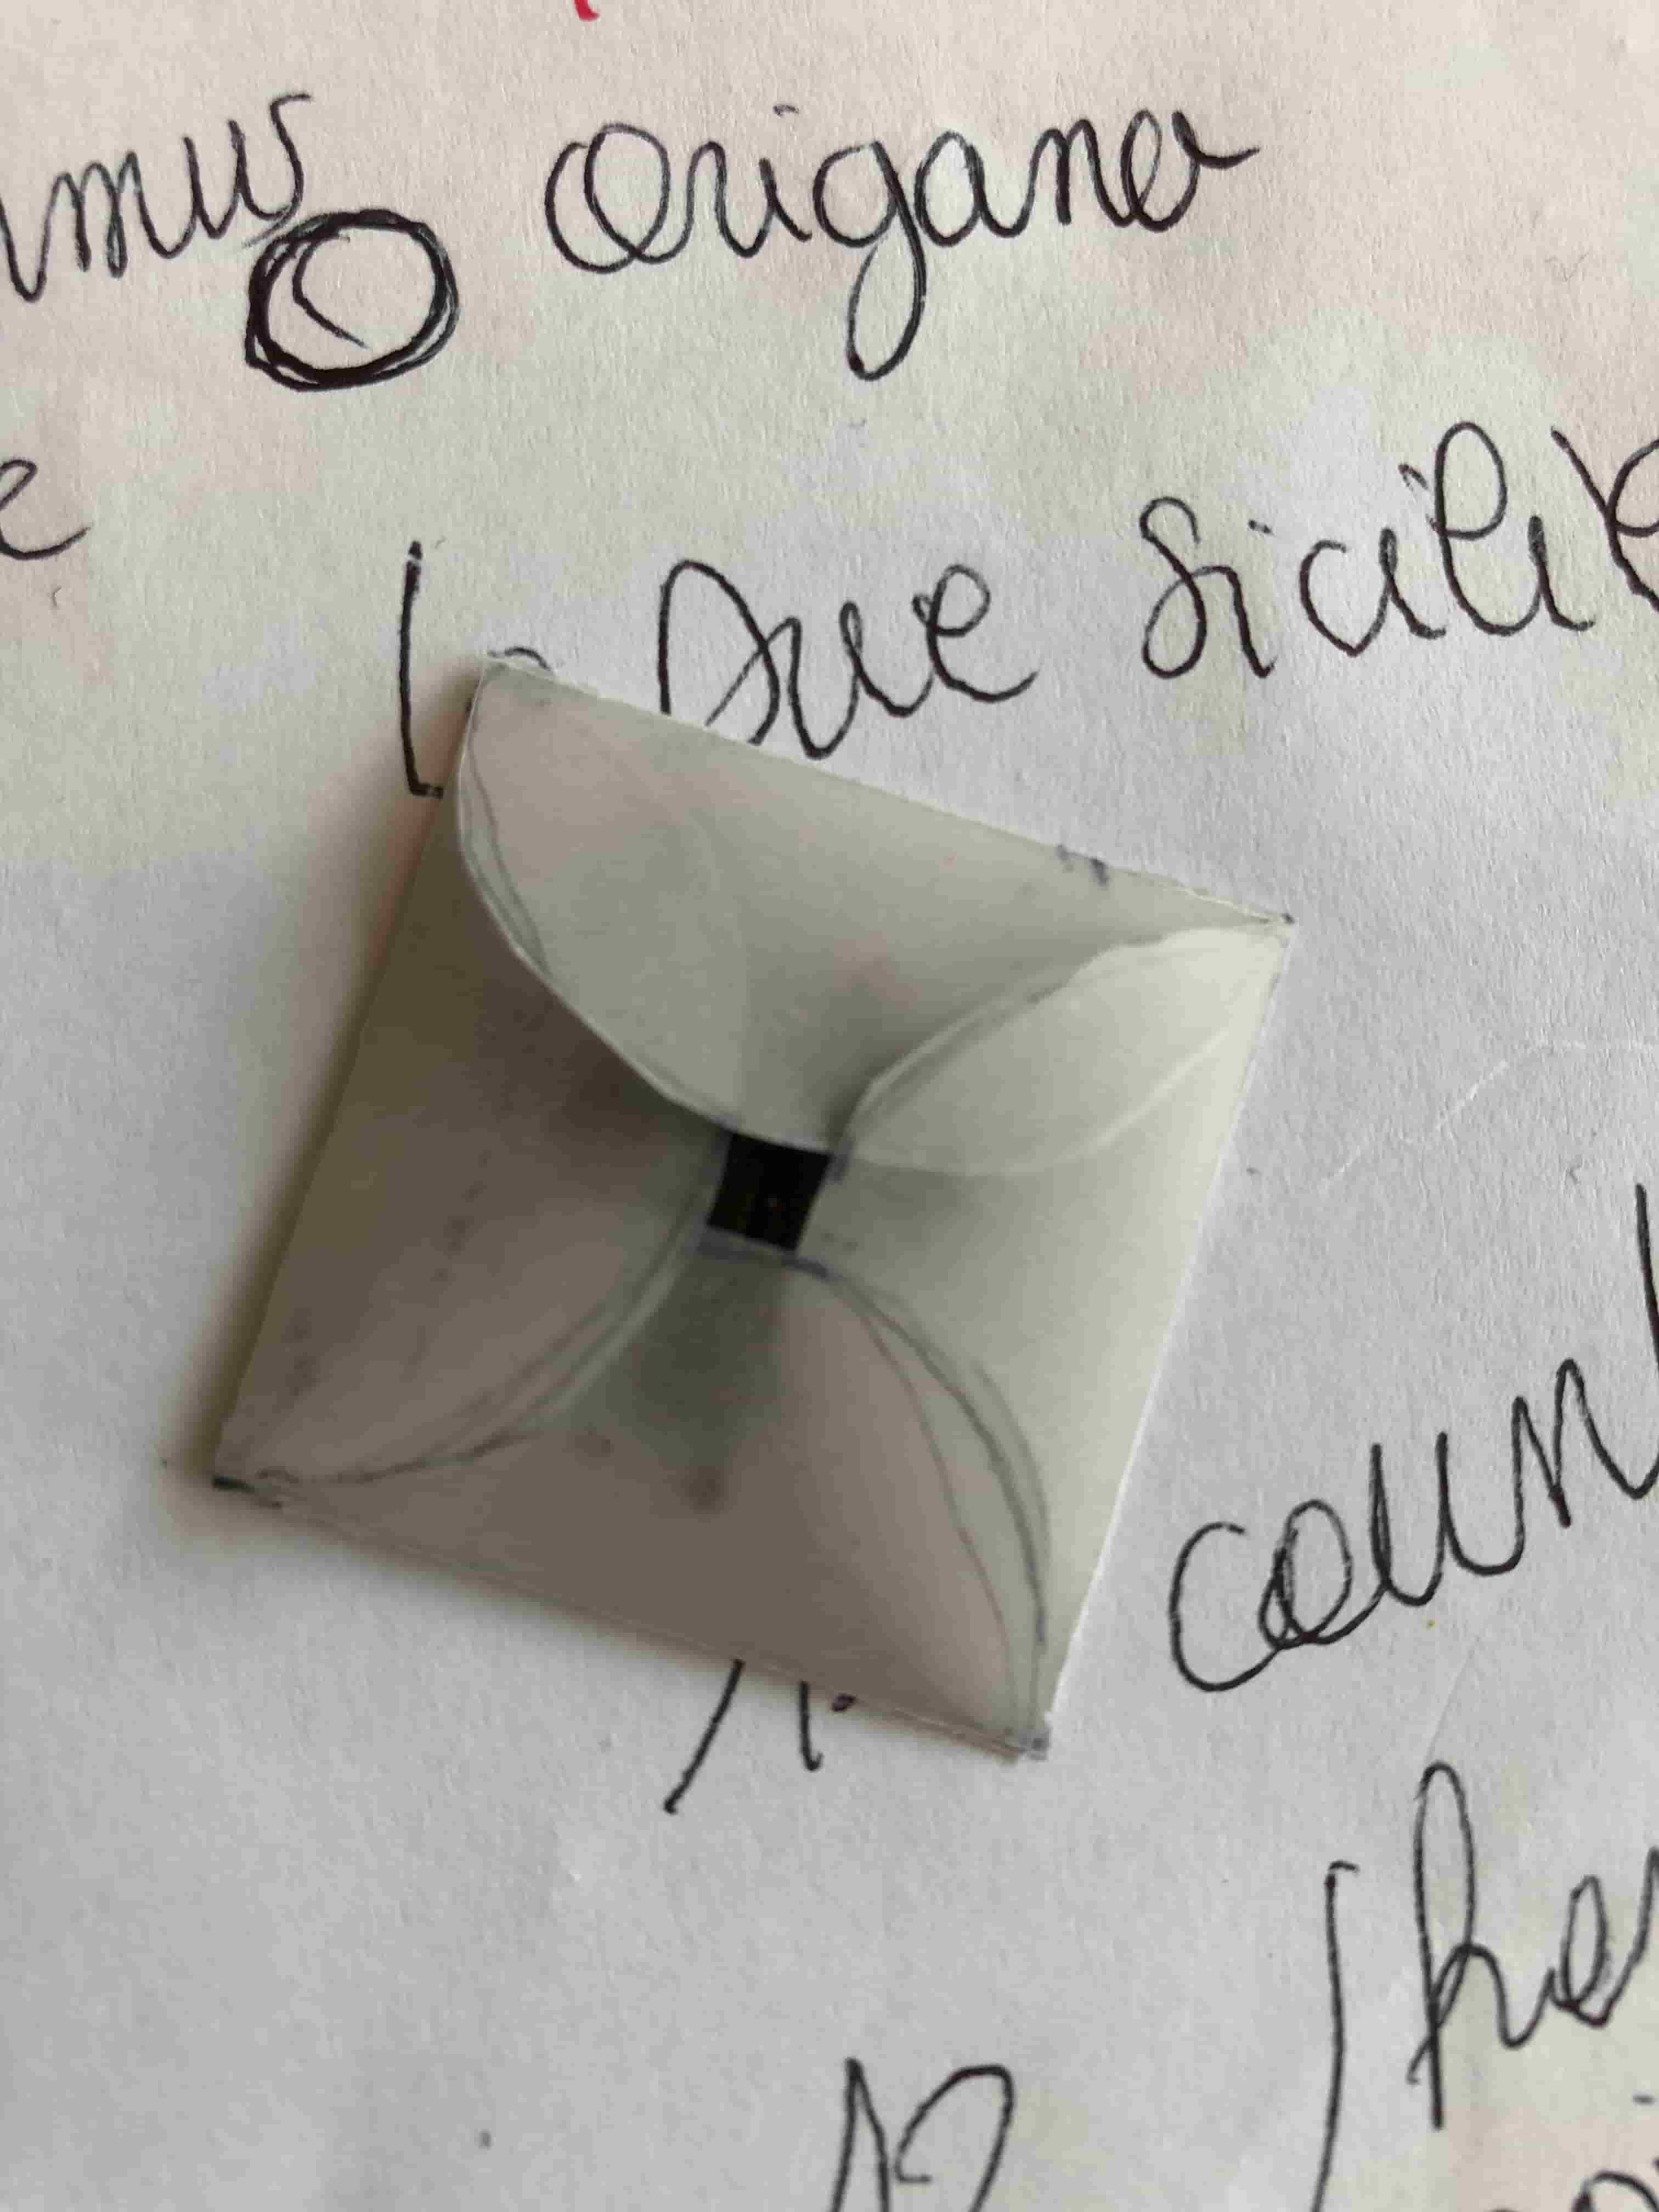
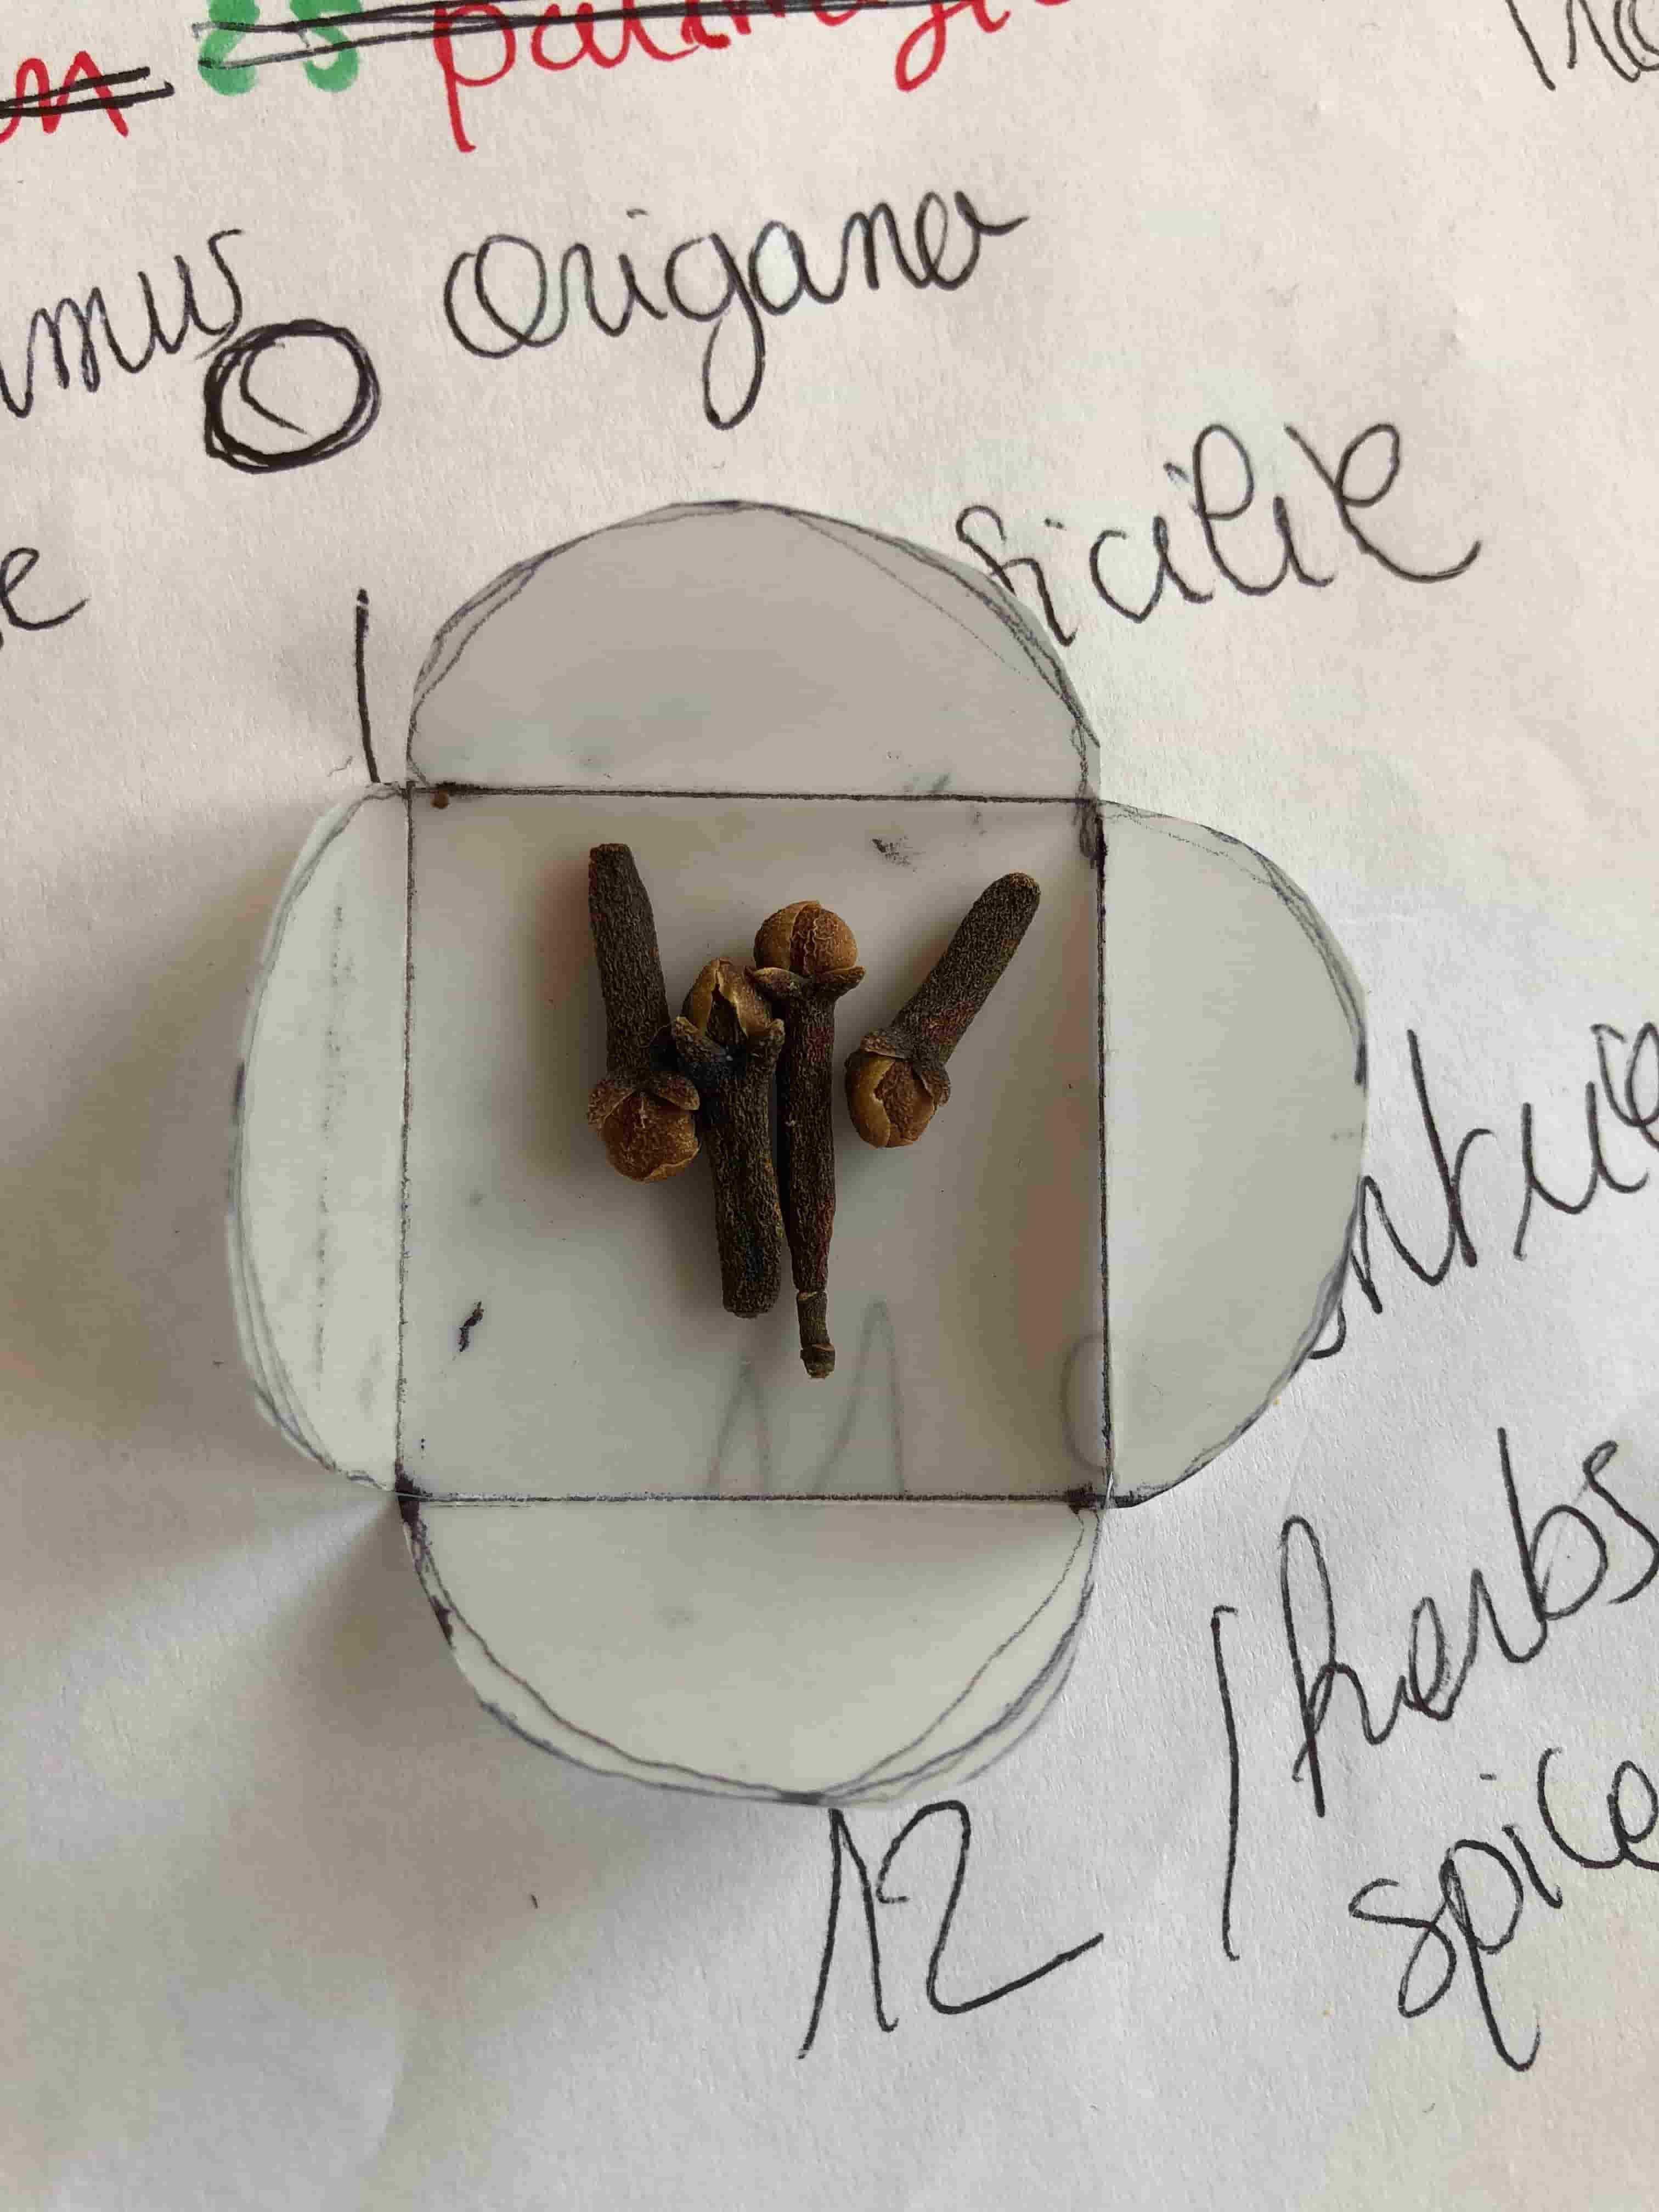
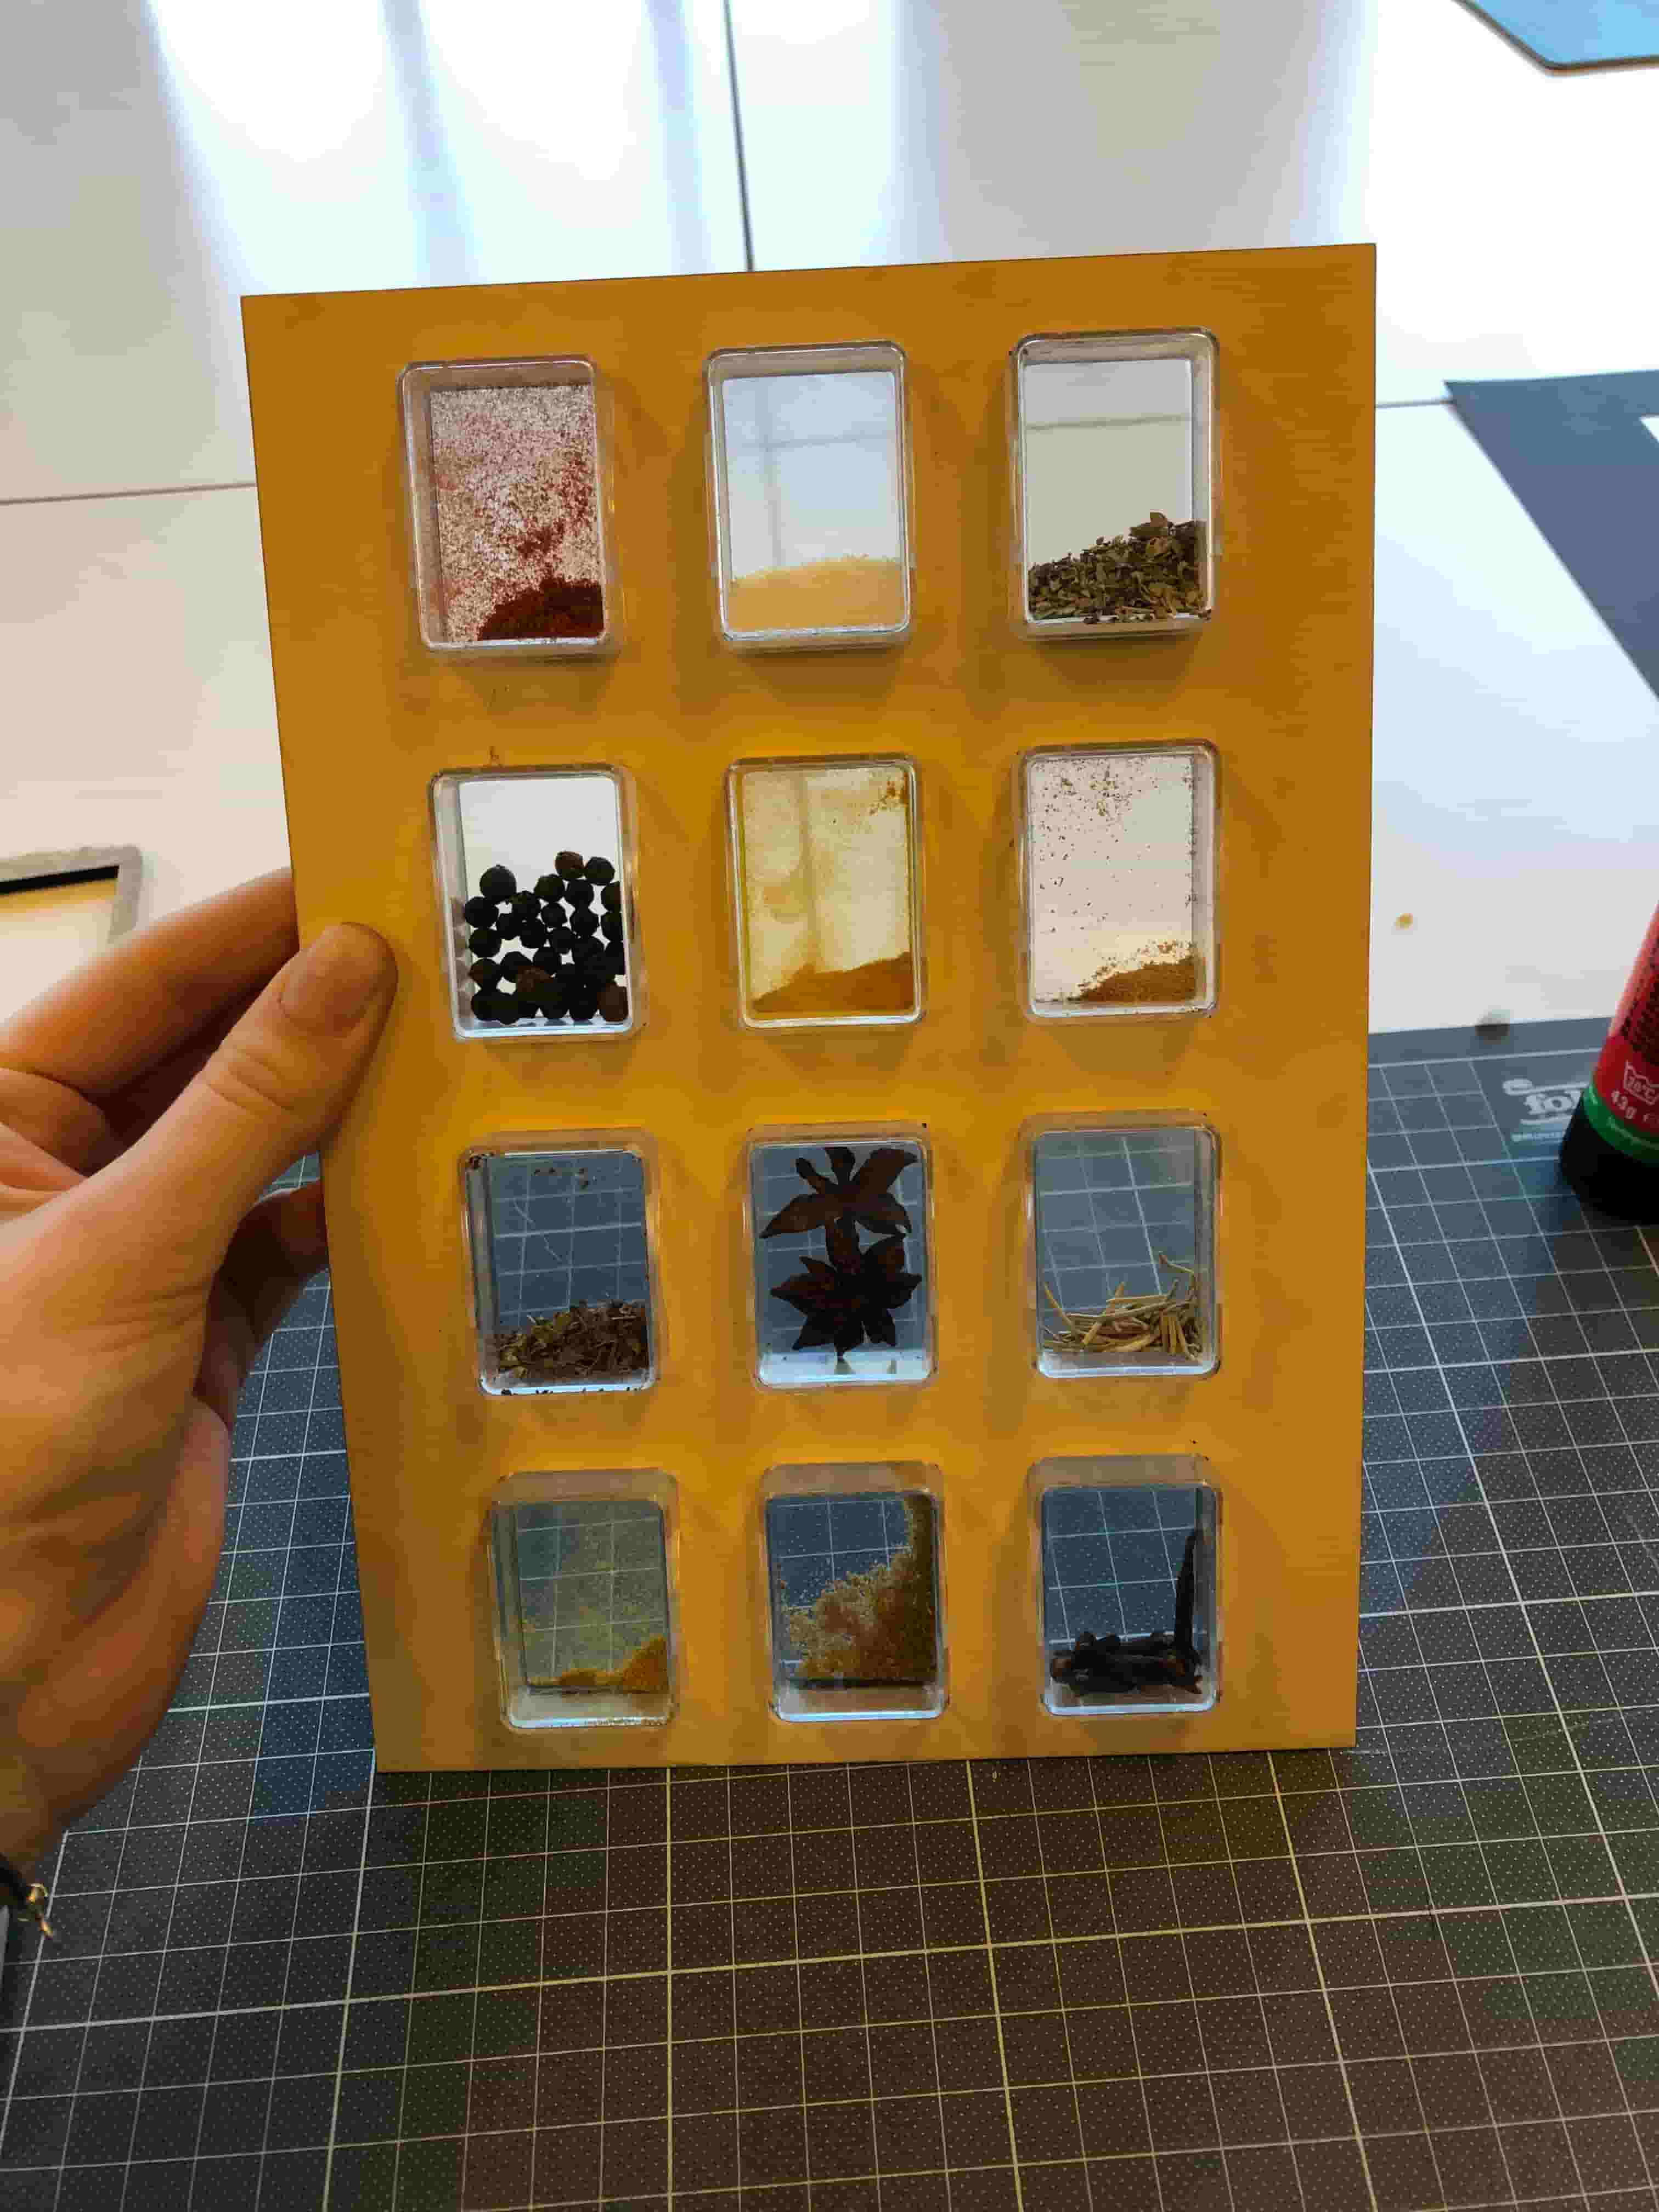
The main problem we encountered was to integrate the herbs and spices to make them accessible without mixing them and that it be small. We thought about different options like gluing them on the map, creating transparent paper envelopes... The best options we found were to use small transparent plastic boxes, this technique is the most aesthetic and practical. Choices had to be made for the project to be feasible, finally we selected 12 herbs and spices used in restaurants of 11 different nationalities.
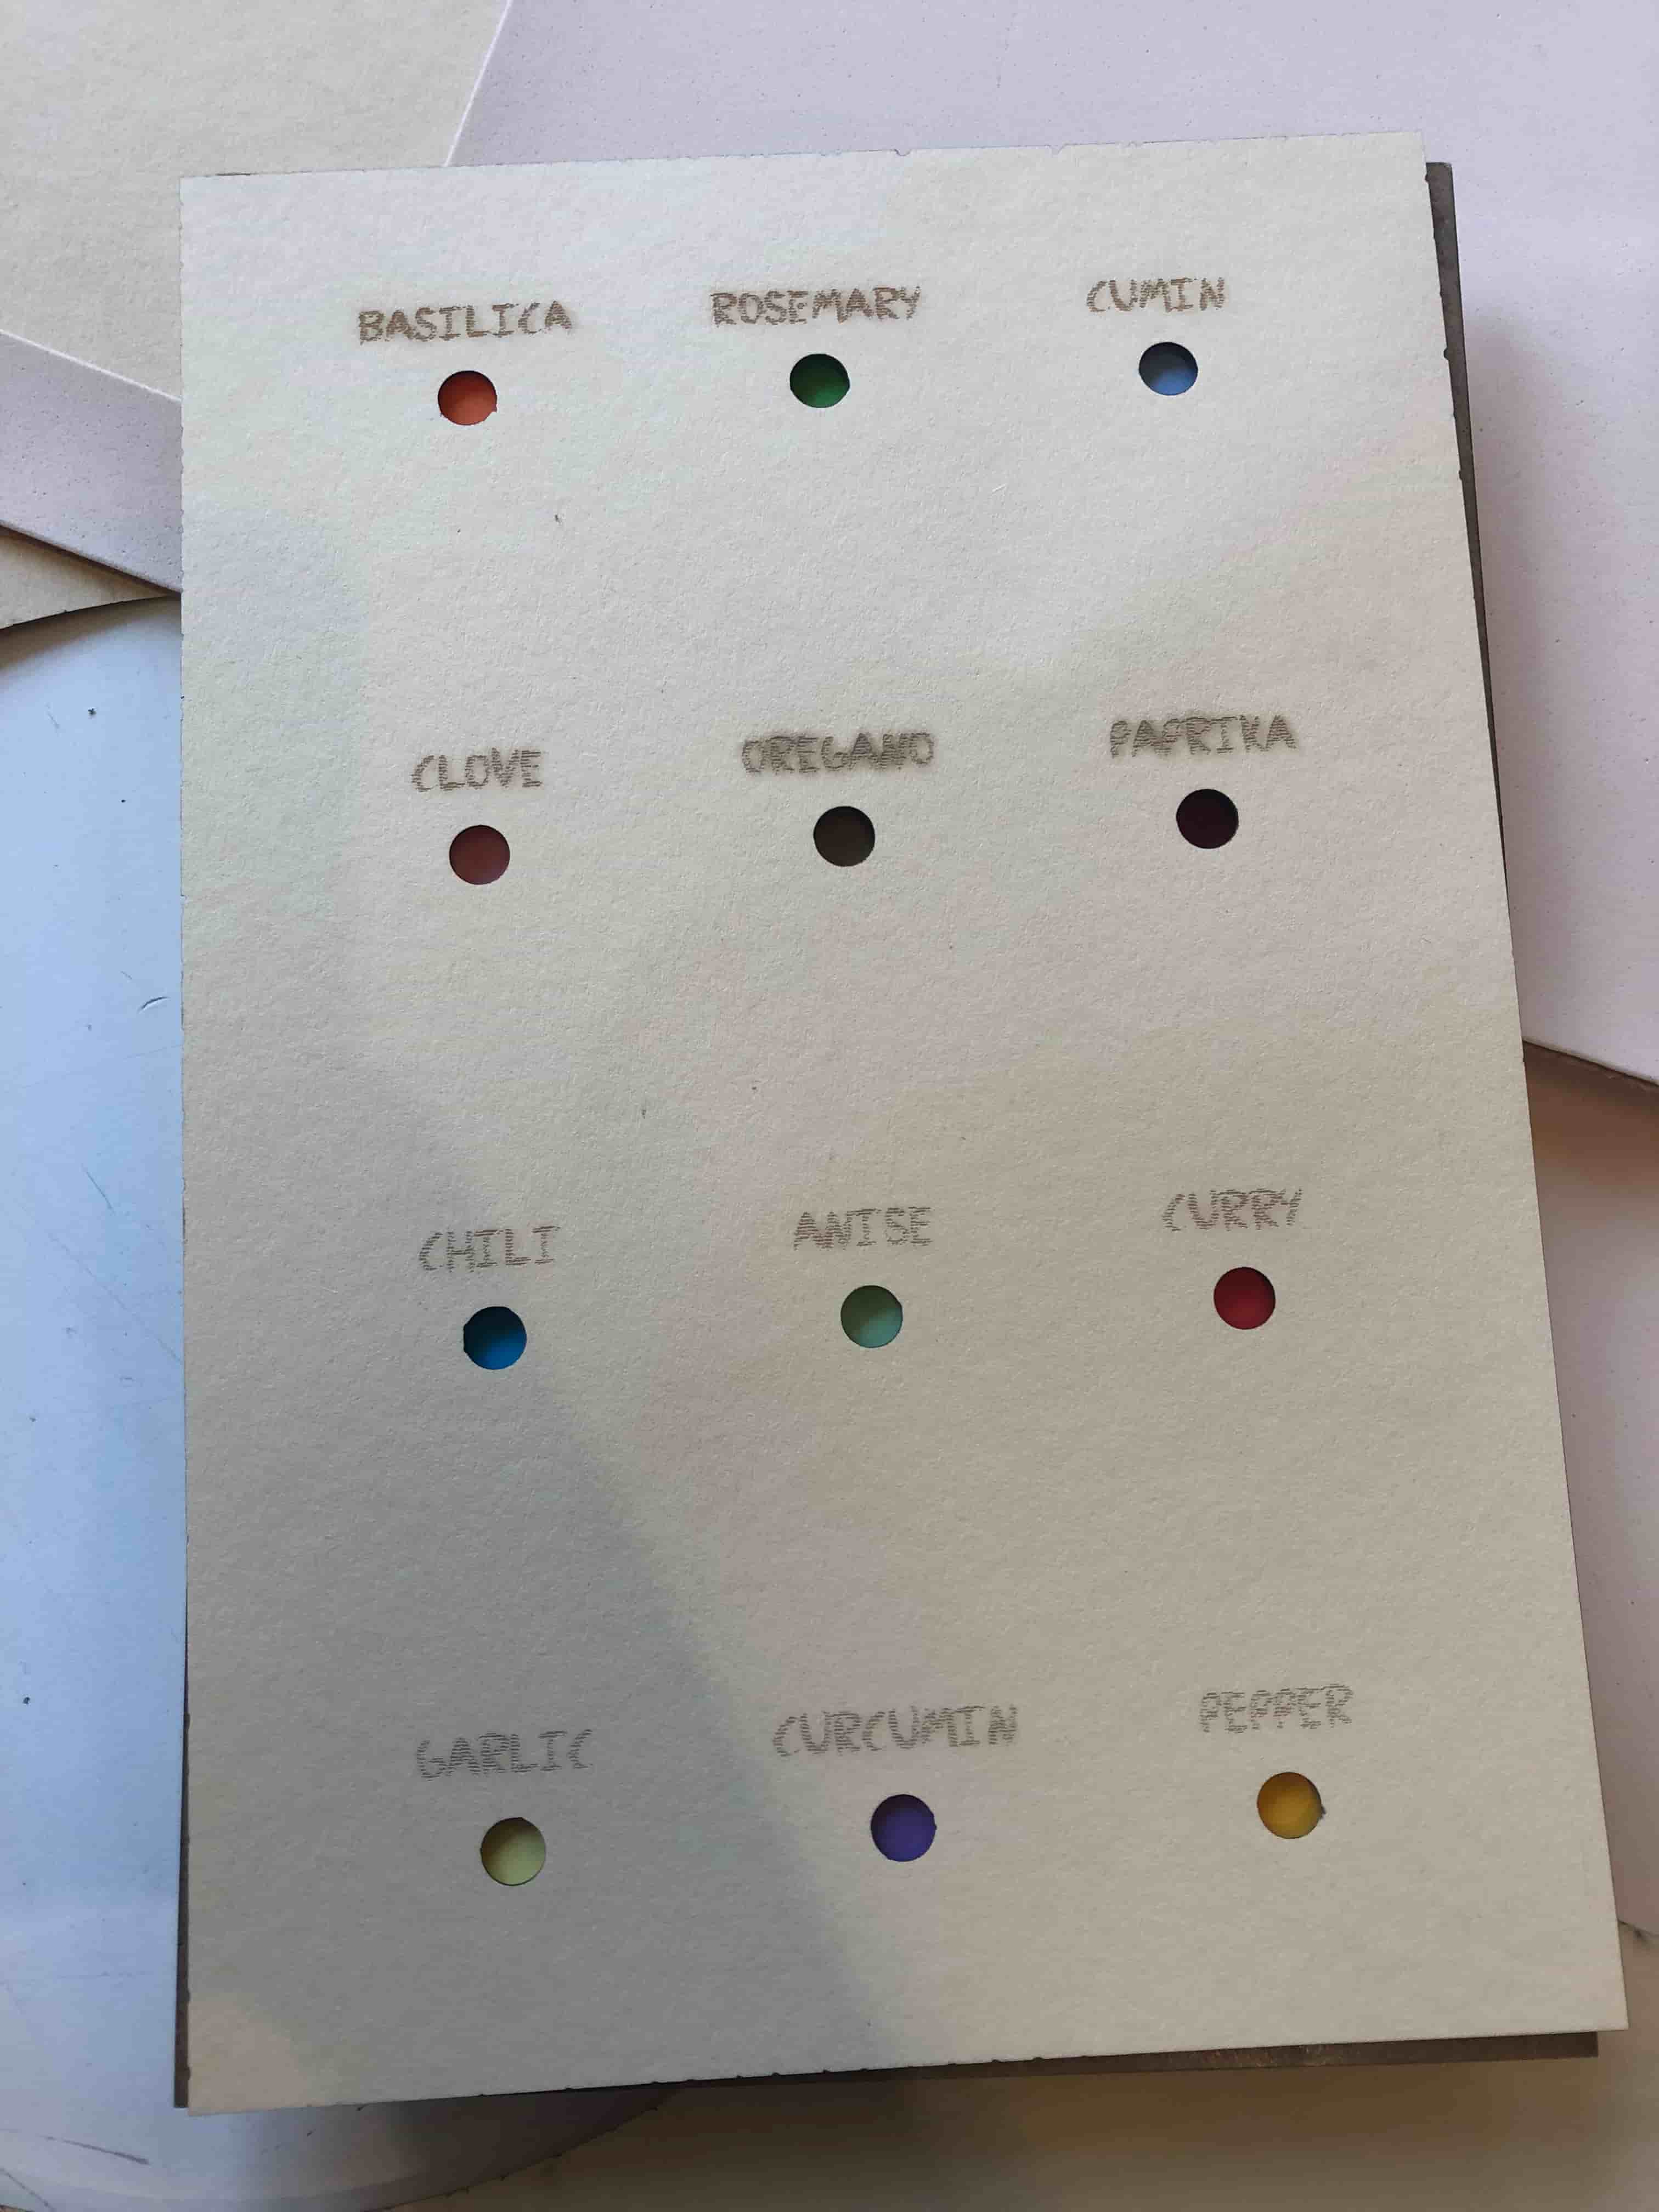
To integrate the boxes into the map, we first tried to make holes in foam, glue the boxes on a wood board... Finally we decided to laser cut some square holes on a piece of MDF. We created exactly the same size of holes as the small boxes to fit it together without glue. We covered this board with paper. On the back we stick small squares of colored papers to recognized each herbs and spices. We decided to put these references behind the box so that people could guess what was in it when they smelled it.
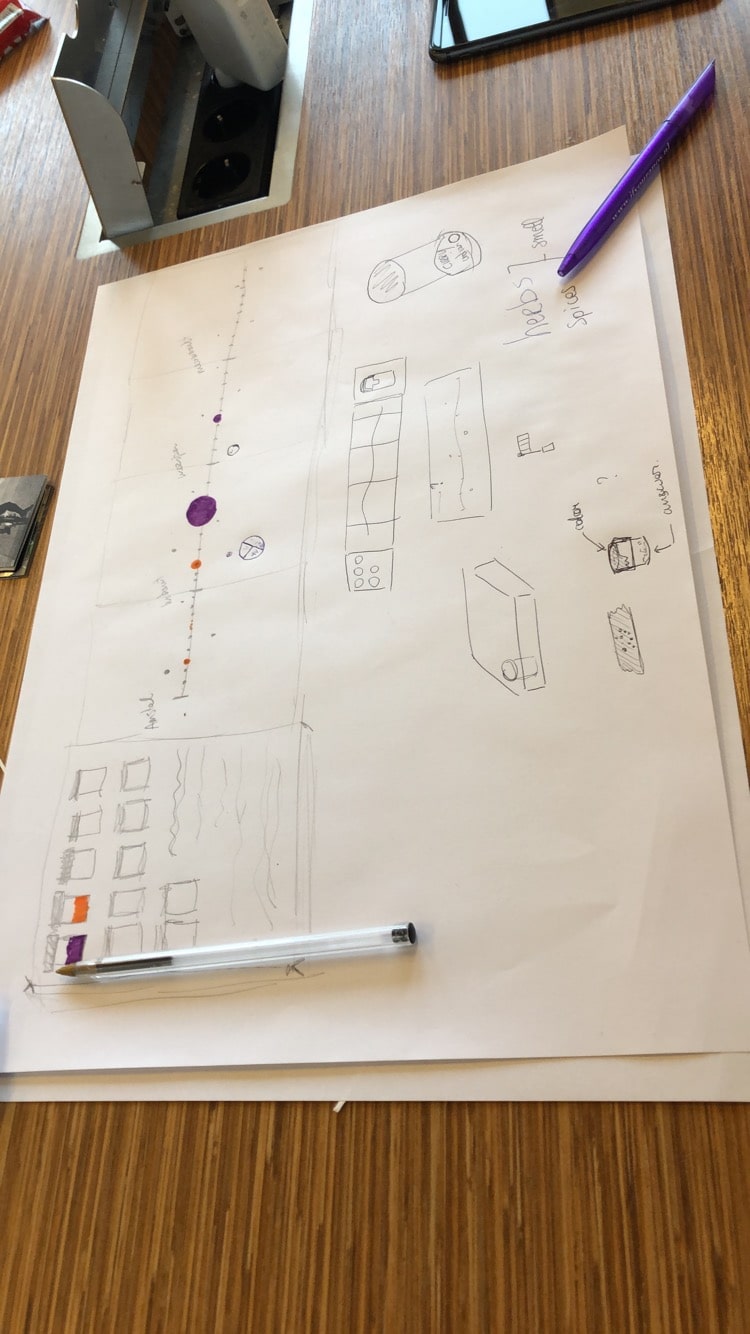
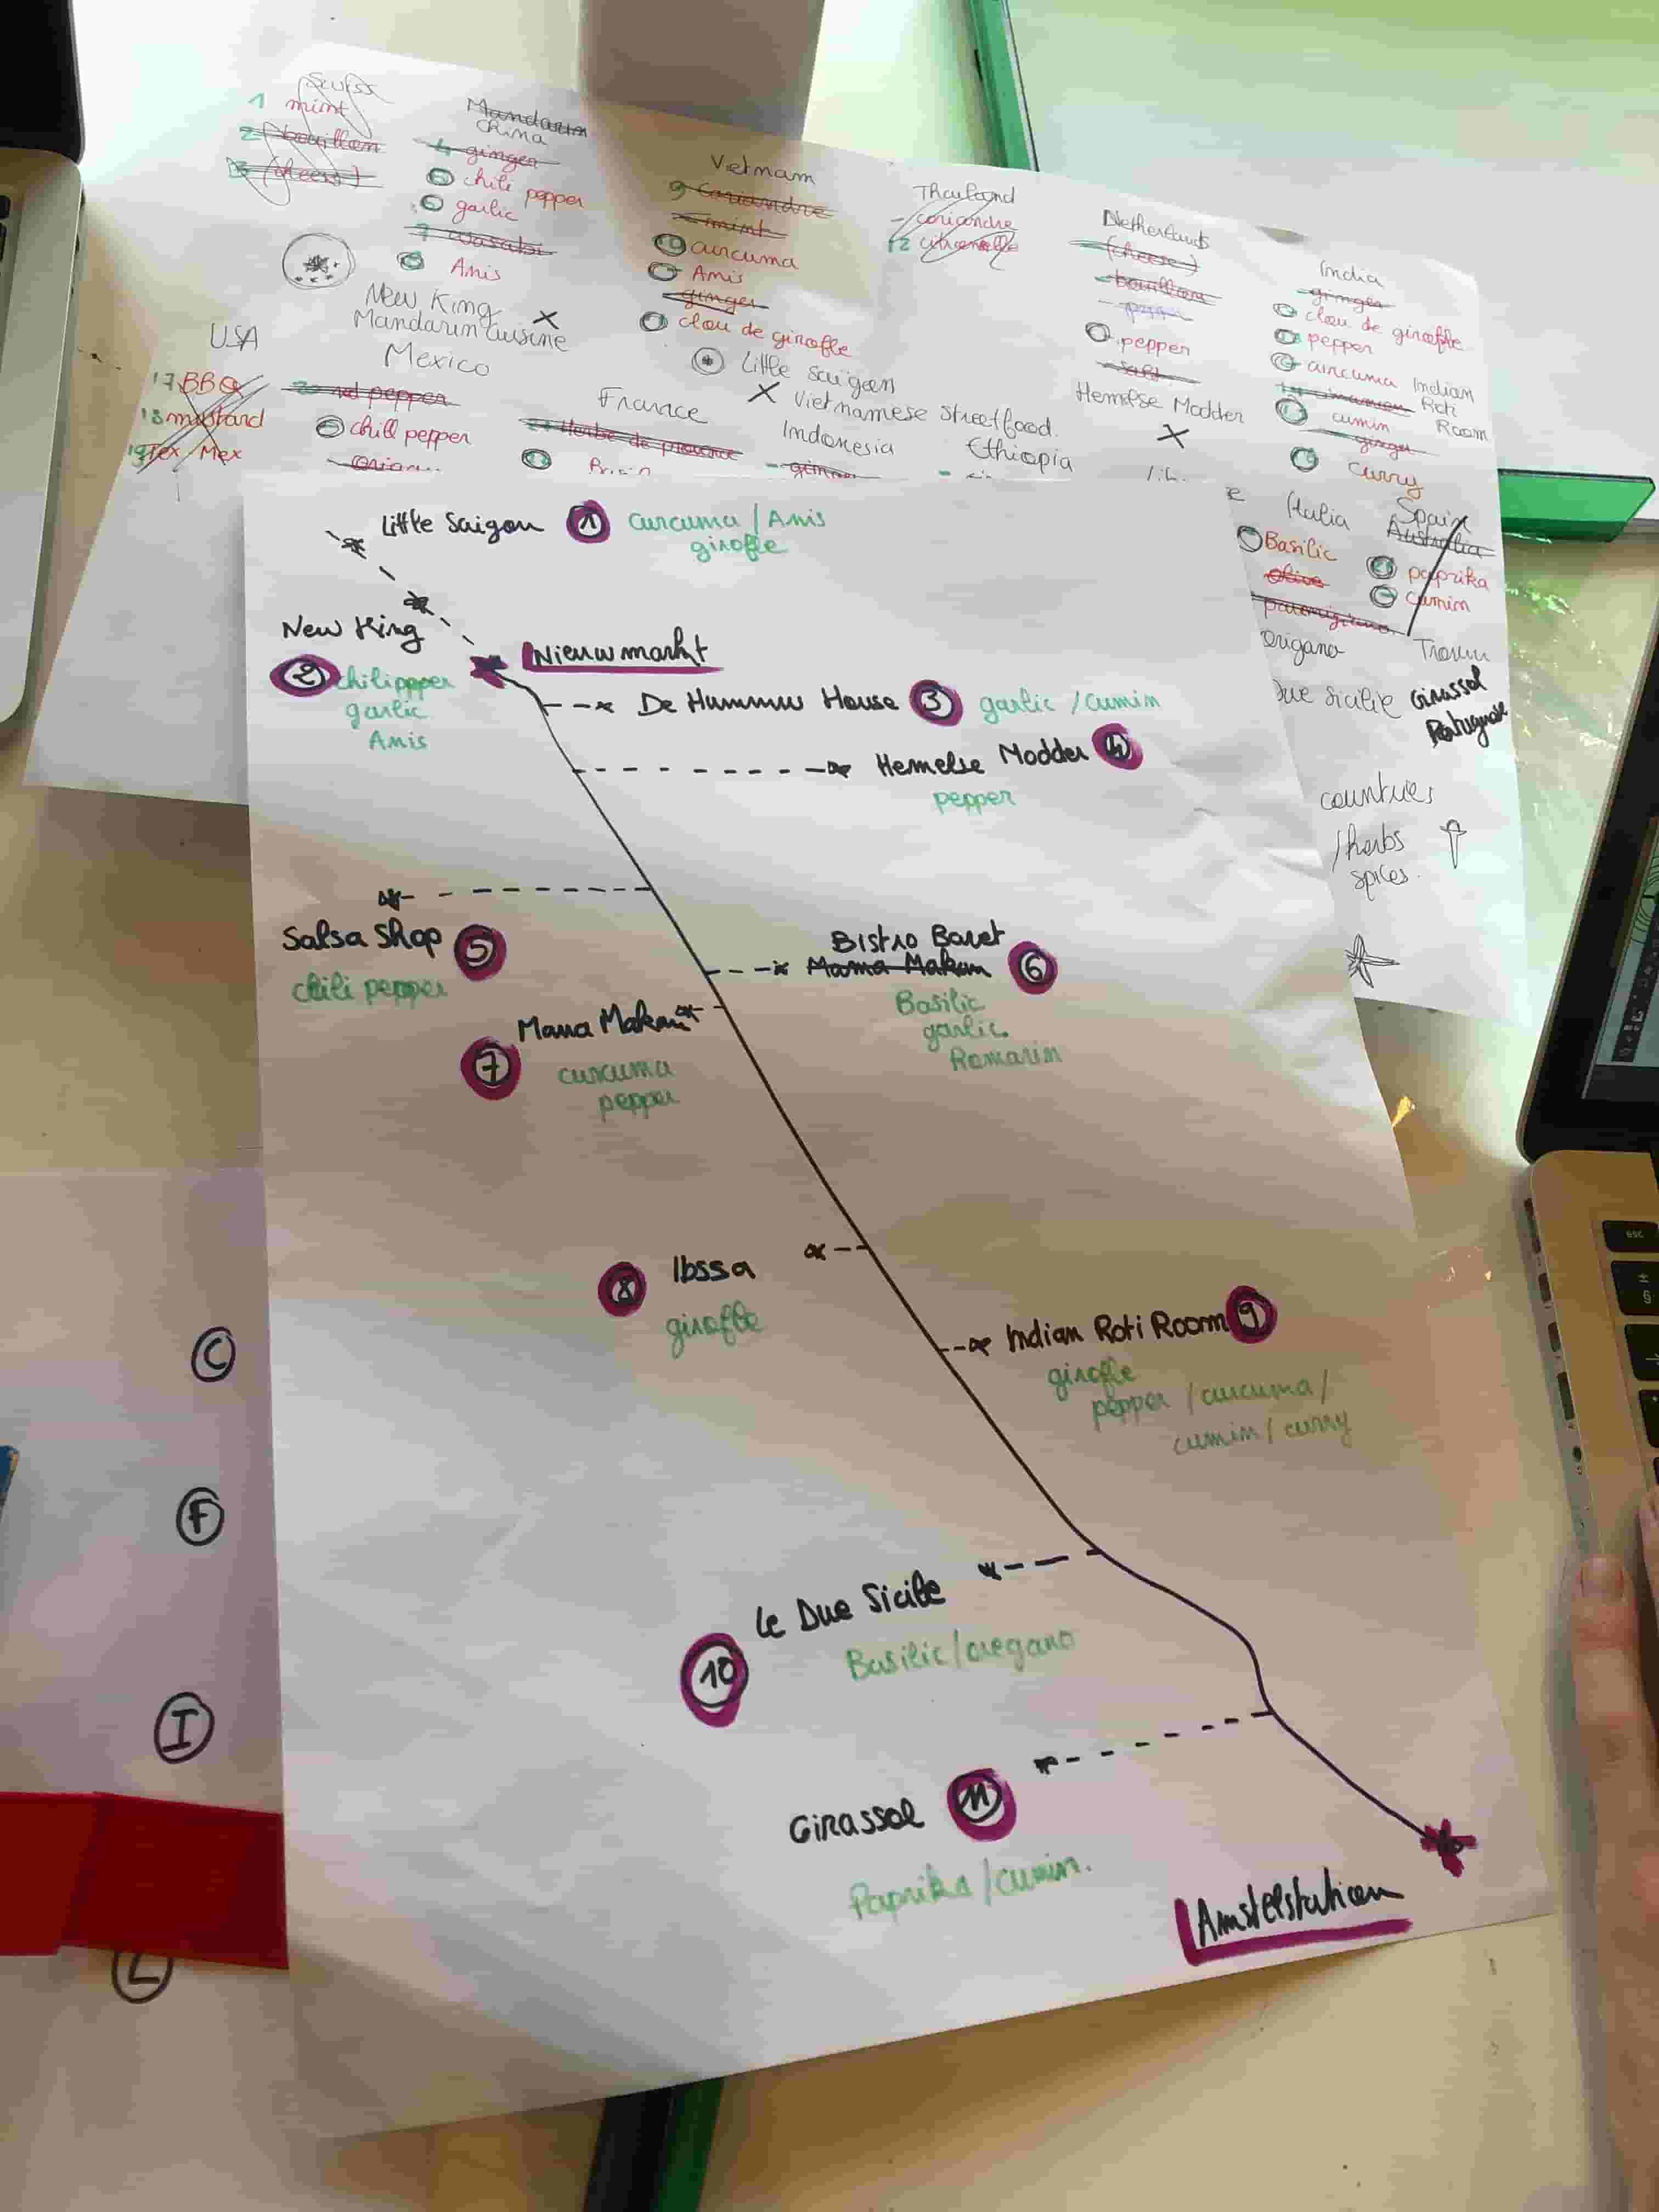
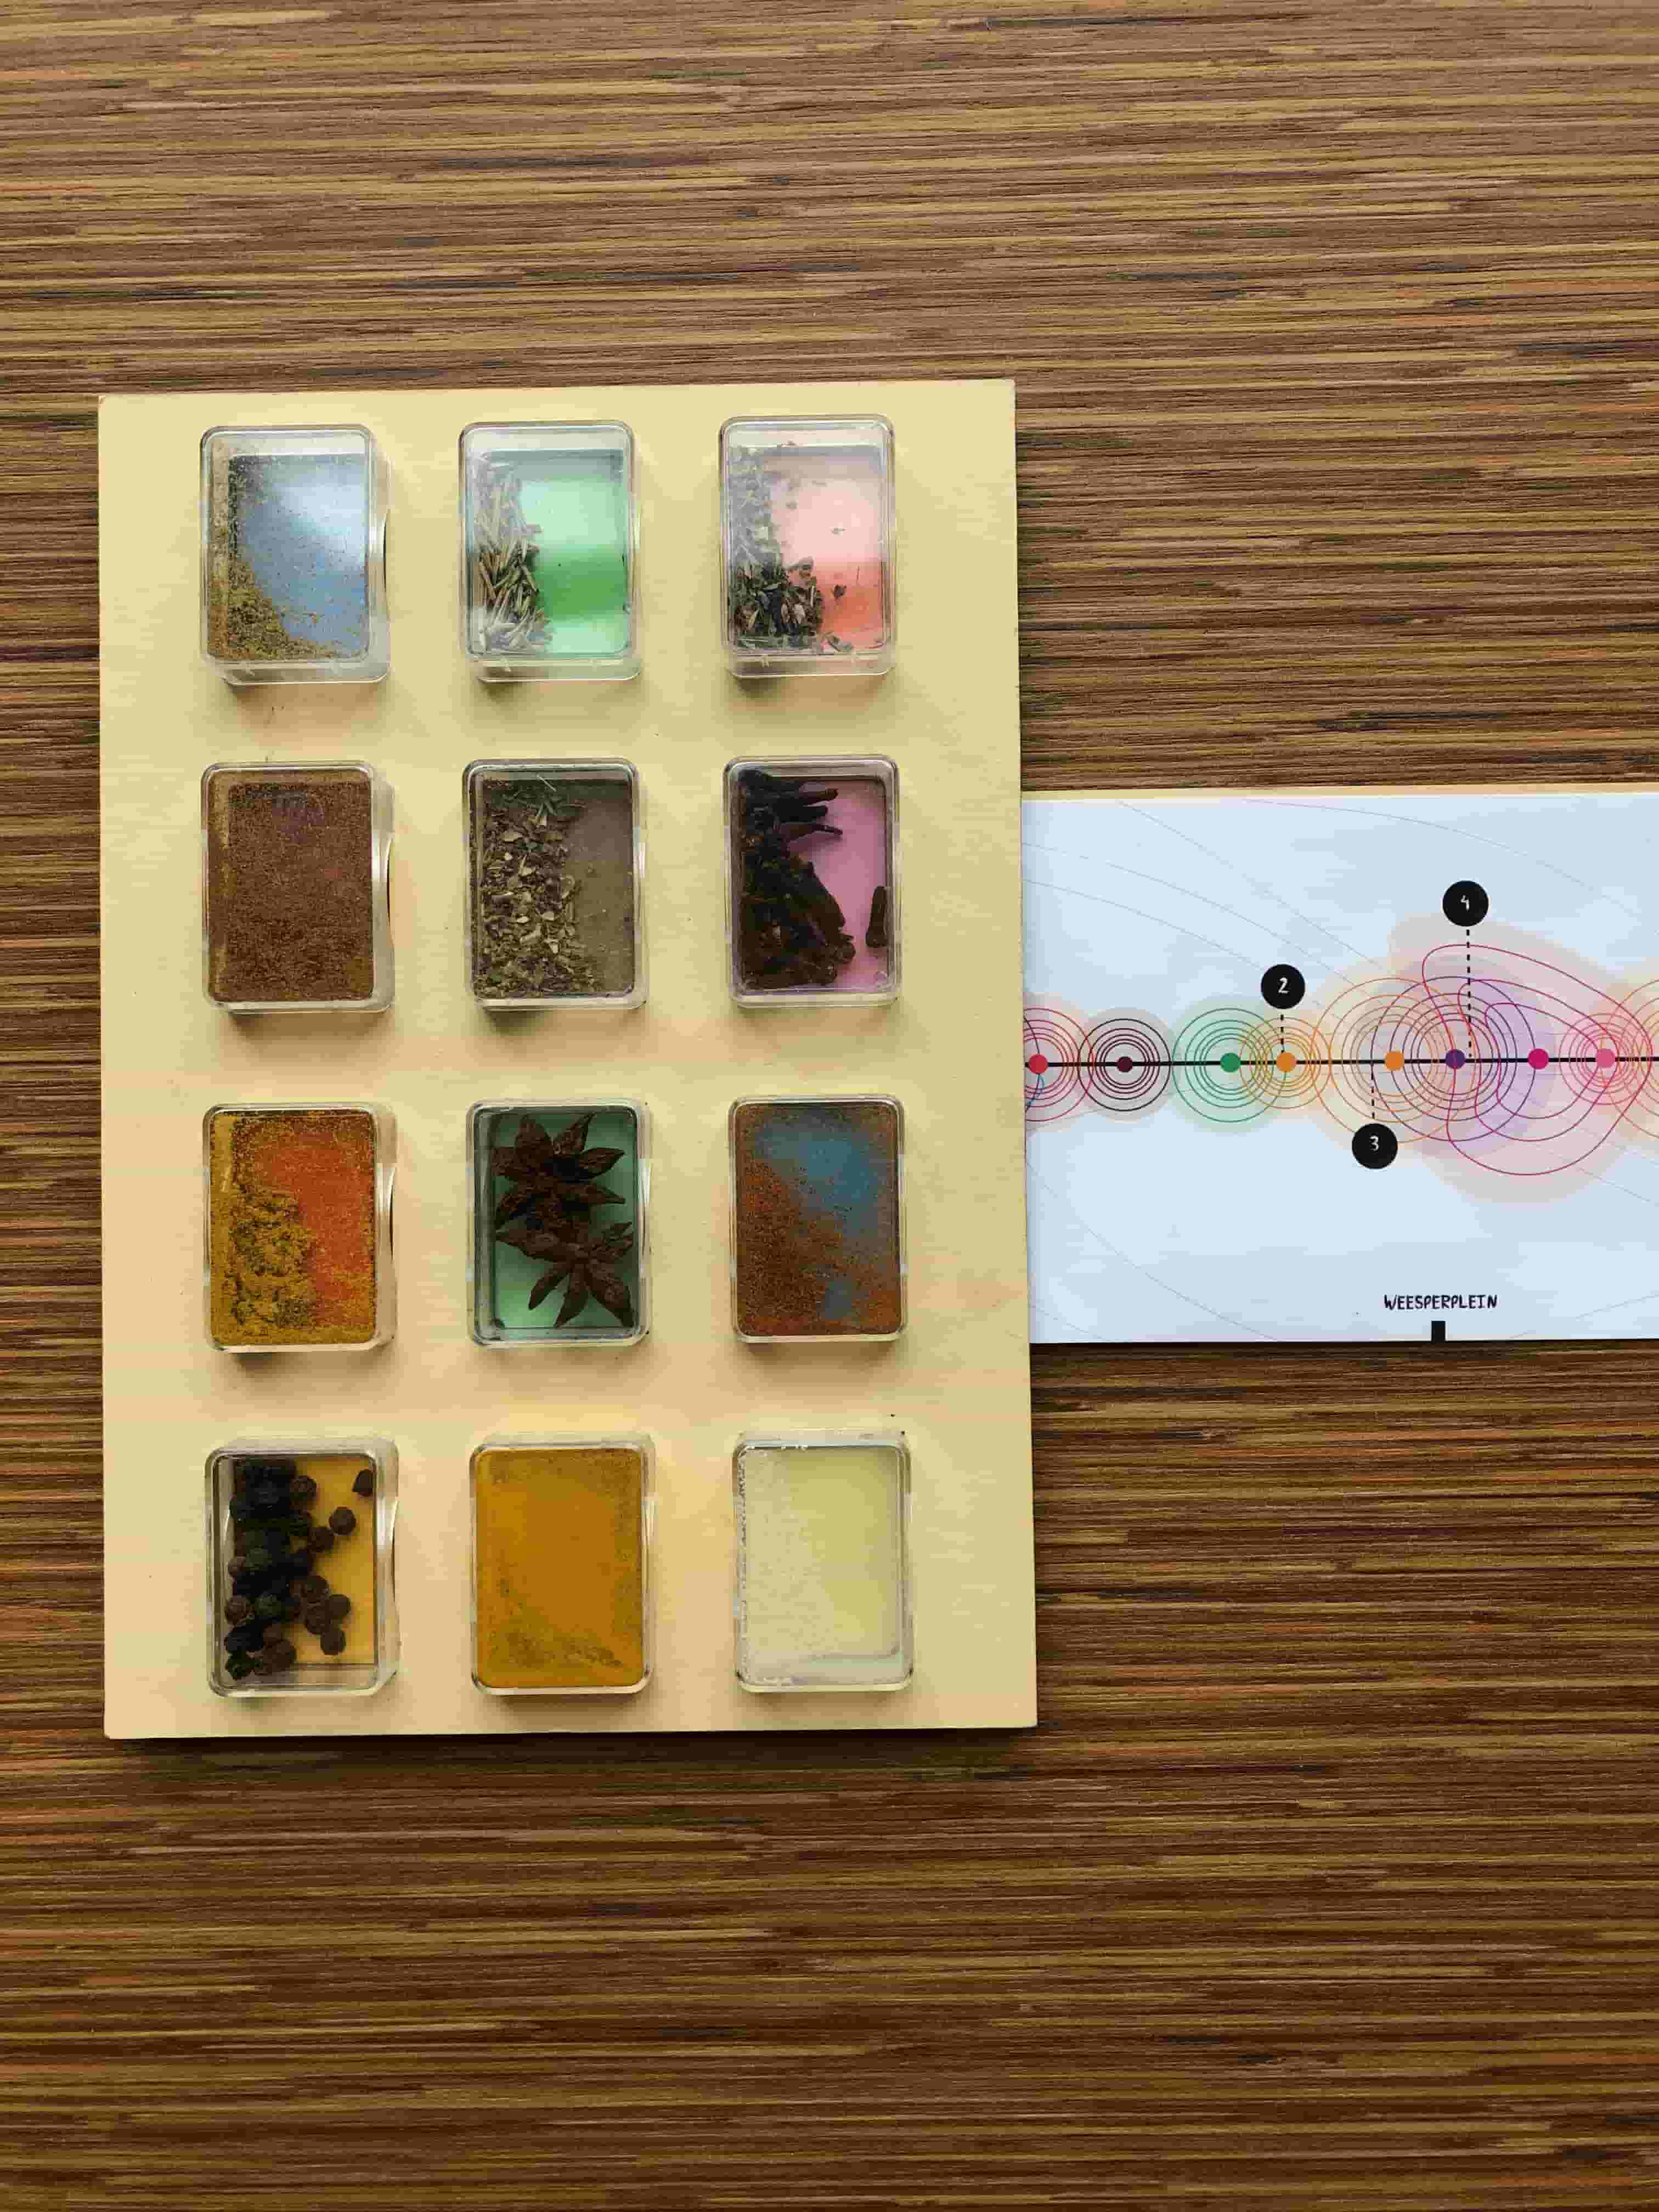
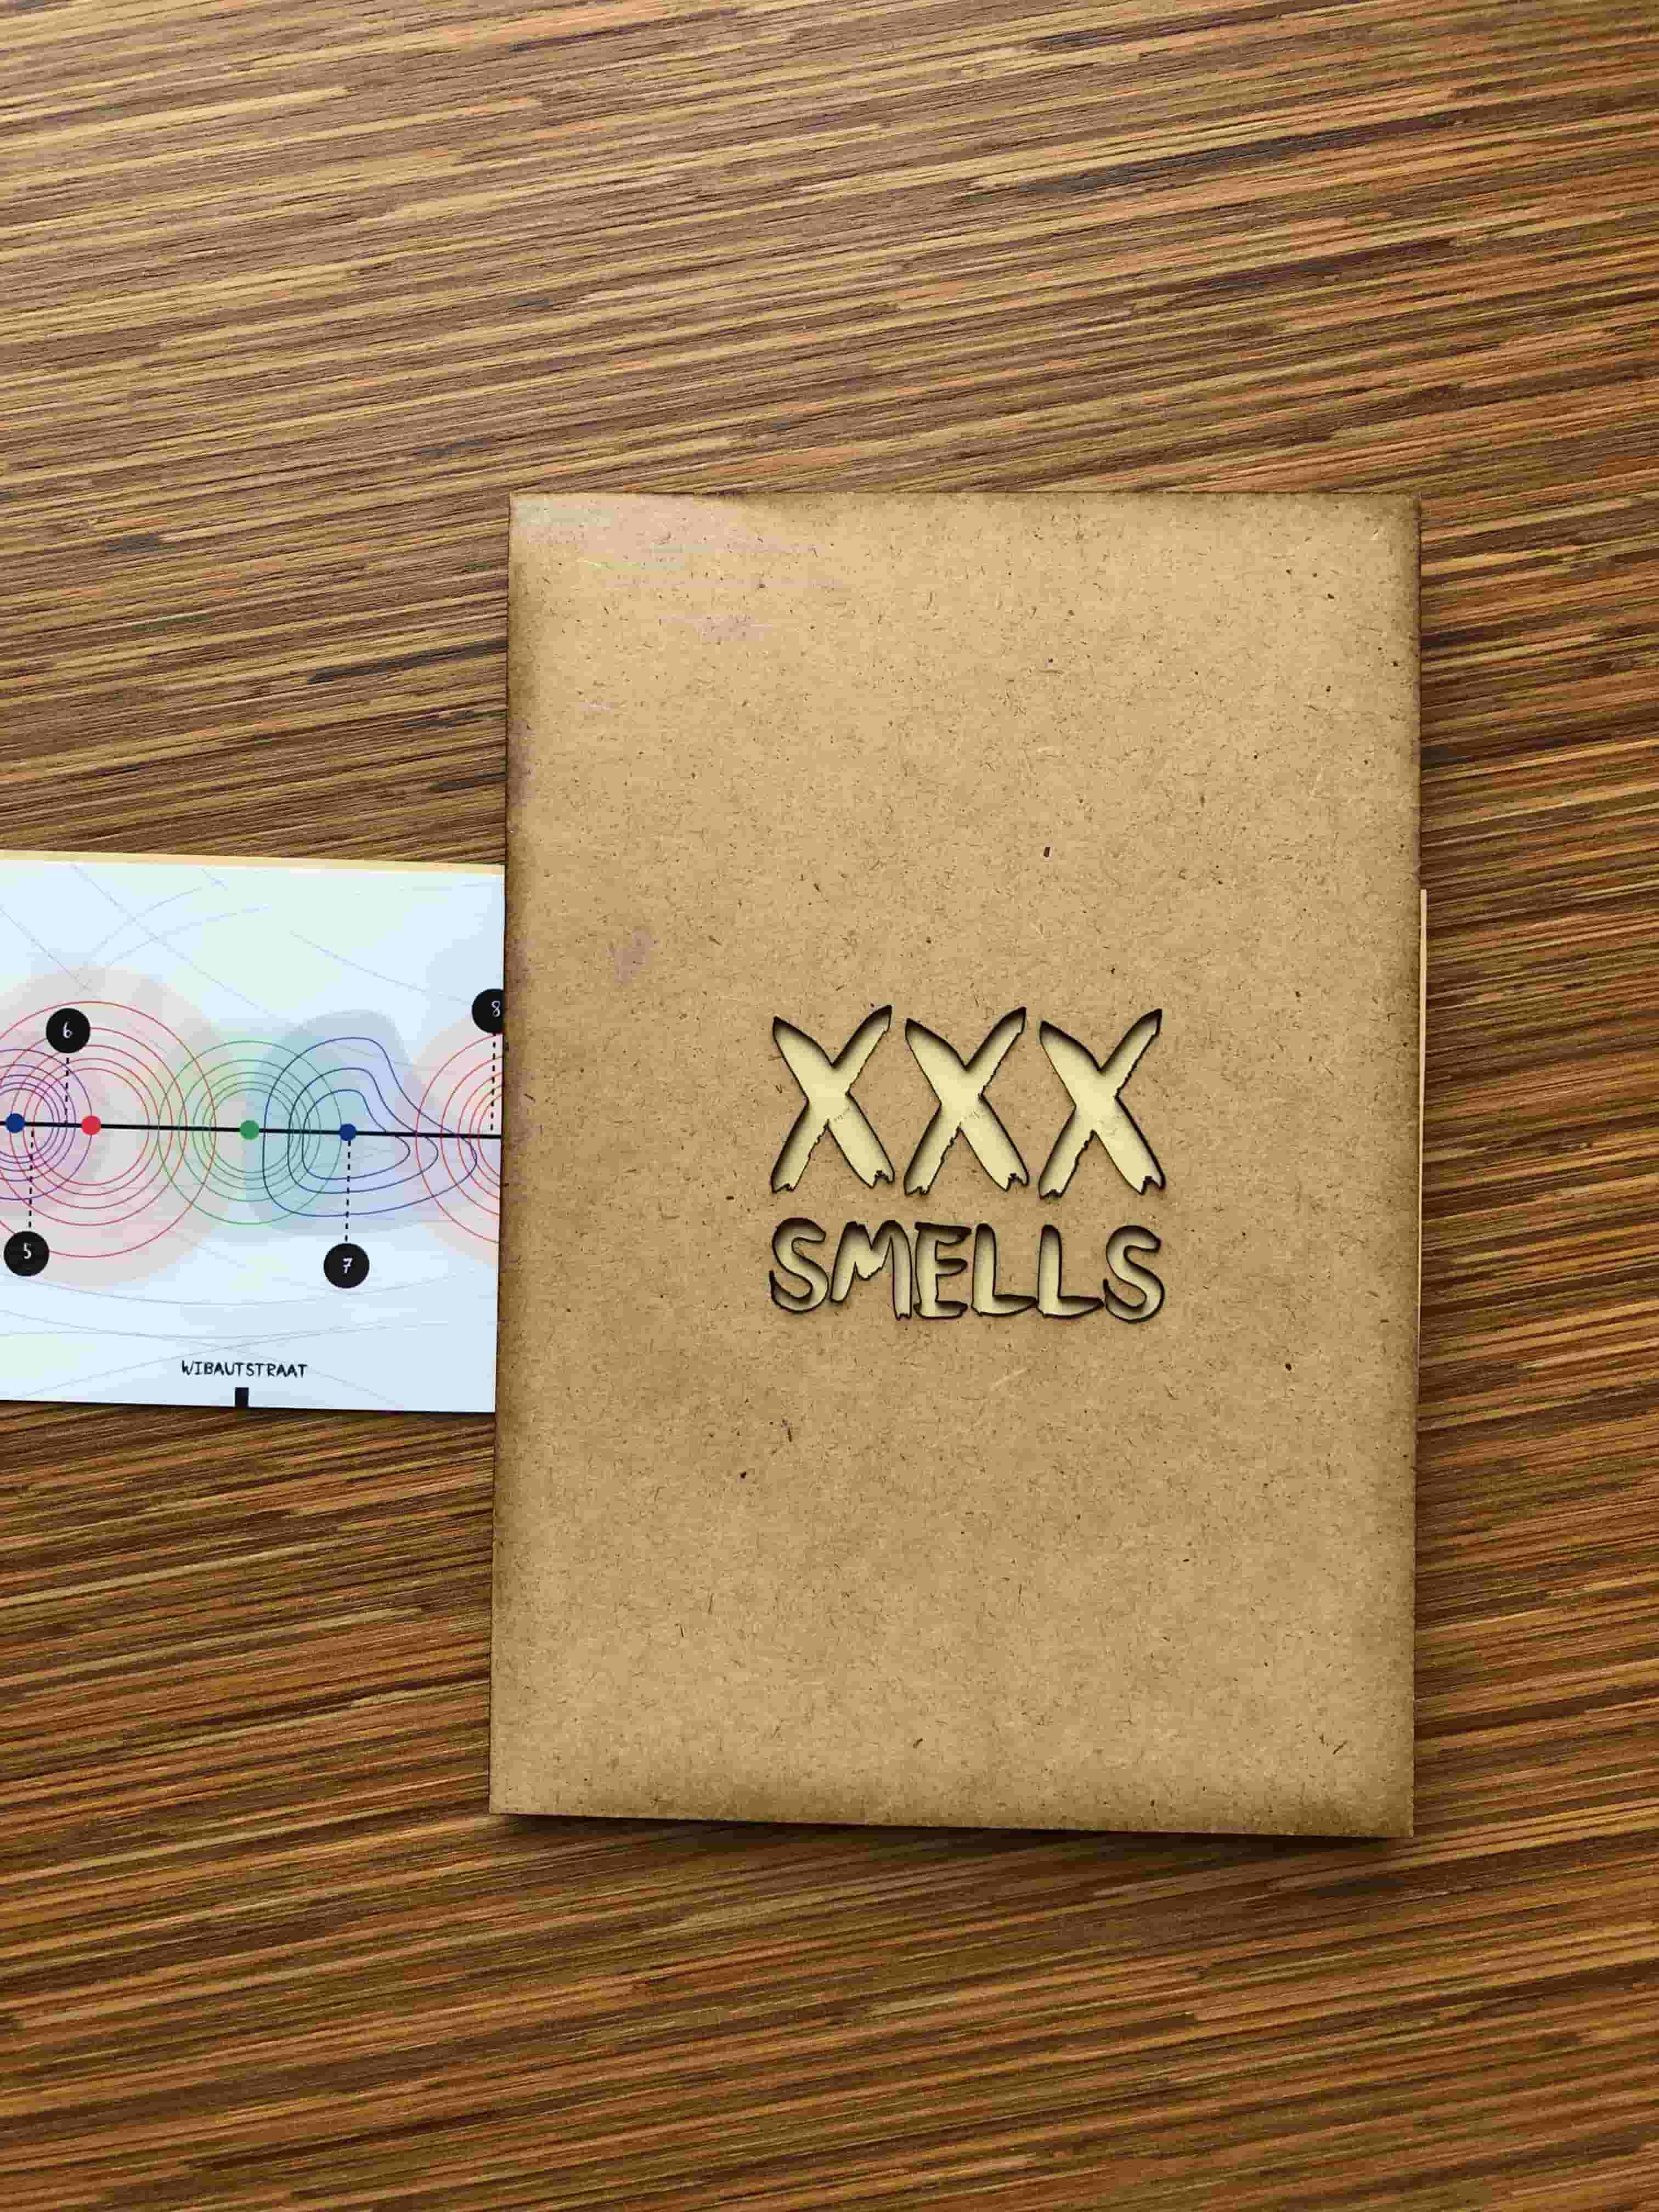
To map the data, we decided to create a map on illustrator. We chose to simplified and schematized the road with the names of the metro stops. The 11 restaurants are placed on the map according to the distance they are from the initial route. The smells that can be smelled near restaurants on the road, are represented by coloured circles. Each restaurant has a number. All numbers are referenced on a map. We also put all the restaurant business cards in place so that we could find them in the city.
The last challenge for us was to include business cards on the map. For this purpose, we cut a wooden board of the same size as the blanket and we glued a thin layer of foam onto it. Before that we made a slot to be able to insert the business cards. On the back we engraved the logo of our project. The final map was printed on paper and glued at the end between the two wooden boards.
This week, the collaboration with Rick went very well, we could easily understand each other and exchange ideas. We were able to combine our graphic design skills.
This week was dedicated to create a map of the Knowledge Mile. We have chosen to work on the cuisine and restaurants of the different countries. First, we started by collecting data on the way. Sounds, business cards, photos, descriptions. These data were then selected to be collected on a map. We decided to work on the smells of the city and restaurants. To do this, we looked for the spices and herbs that countries use in their traditional dishes. Indeed, on the way, we could smell different smells of food depending on the surrounding restaurants. We used the most common spices and herbs to make them smell on our map.
This week, four of us started working together. We did a lot of research before we left to collect the data. (On TripAdvisor, Google Map...) We decided to work on the kitchens according to the countries. We identified on the map the restaurants we were going to use. Several data were selected for collection in each restaurant. After collecting the data we decided to focus on smells so we looked more closely at the typical dishes of the countries.
We first started the four-way project with Elisa, Duy and Rick. We divided the roles to collect the data. We had a lot of ideas, so it took a lot of discussion to keep the most relevant ones. After the collection, we split into two groups. I worked with Rick V, the collaboration went very well. We were always in exchange and we did everything together. As we are both graphic designers, we easily agreed on the visuals of the project.
I have learned a lot during this week. We had a lot of work to do, so we had to get organized. We have experimented with many new techniques to be able to add herbs and spices to the map. Many different materials were used for the project. We learned how to collect data, select the most important ones and map them in a clear and understandable way.